| The easiest way to explain some of the functions of J-DSP is to work
through a simple example.
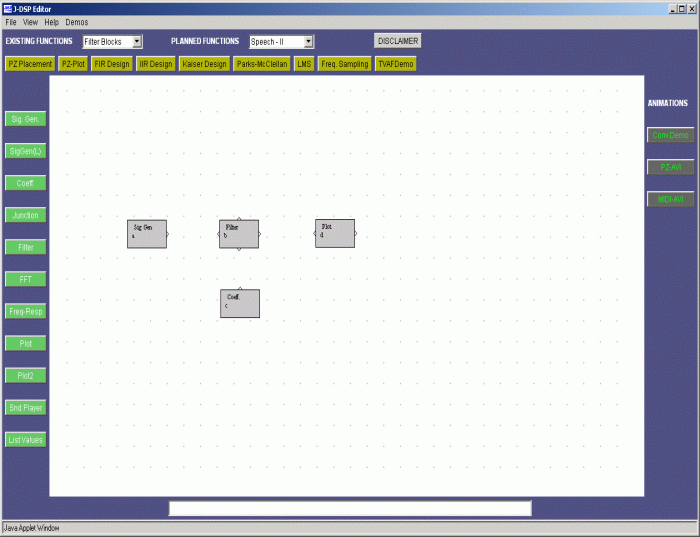
Start the J-DSP editor. It may take 30 seconds to download the program
and a few more seconds to establish the first block but once the first
block is established, the program should run quickly. Adjust the
size of the J-DSP editor window so that you are still able to read this
text or make a printout of this page. Press the "Sig Gen" button
on the left part of the window. Move the mouse to the center of the
window and push the left mouse button. You have created a signal
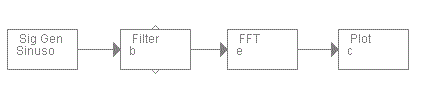
generator box. Similarly, create a Filter and Plot box and note that
boxes can not be placed on top of one another. Your editor window
should now look like the following:
To select a box, click on it and it will become highlighted. Once a
box is highlighted, you can move it by placing the mouse arrow over it,
holding down the left mouse button and while holding the button down, dragging
the box to a new location. To delete a box, select it and press the del
key on your keyboard.
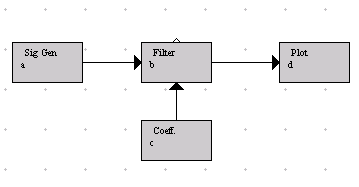
Next, click inside the small triangle on the right side of the signal
generator box and while holding the mouse button down, slide the mouse
arrow to the triangle on the left side of the filter box. Release the mouse
button to create a connection between the two boxes. Always make the connections
in the direction of the signal flow. Outgoing signals, leave boxes on the
right, incoming signals enter boxes from the left.
|
Box
|
Inputs
|
Outputs
|
|
Input
|
0
|
1
|
|
Output
|
1
|
0
|
|
Filter
|
1
|
1
|
|
Add
|
2
|
1
|
|
Multiply
|
2
|
1
|
Number of inputs and outputs of the different
boxes
Now, connect the Filter box to the Plot box so that your editor window
looks like the following
On the right, you can see a preview of the input signal. Create a sinusoid
of period 15 samples and amplitude 3.75 as shown in the figure below and
give the box a name. When all of the parameters have been entered, press
the update button to update the signal preview and remember that whenever
changes are made to this box, the update button must be pressed in order
for the changes to take effect.
Next, we choose our input signal. Double click inside the "Sig Gen" box and a
dialog window appears. If you do not see a dialog window, you are using an older
internet browser and must download the newest version of the internet browser and start over.
On the right side of the signal generator window, you see a preview
of the signal. You may change the name of the signal, the gain, the pulsewidth,
the period and the time shift by typing the desired value into the appropriate
box. The signal type can be changed by clicking on the pop down menu and
selecting a signal. If you select a self-defined signal, an edit signal
button will appear allowing you to edit the signal.
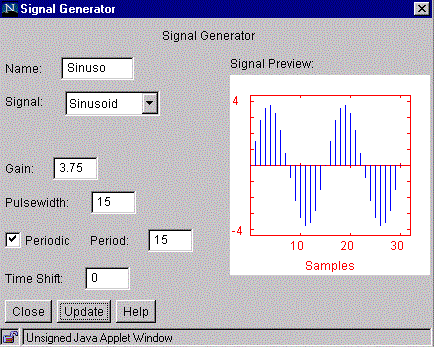
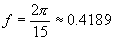
Note, that the sinusoid has a frequency of
Now push "Close" and the dialog window closes.
Next, we want to take a look at the output. Double-click inside the
Output box and a new dialog window will appear. You should again see the
input signal because the filter is just letting the signal pass through
unaffected. If you push ``Values...'', a table with the values of the signal
pops up. In the first column you see the indices of the samples and the
second column shows you the values. Close the value dialog box.
To view the signal in the frequency domain, insert an FFT box between
the Filter and the Plot box as shown below. The FFT box can be found under
the "Freq. Blocks" menu.
Double click on the FFT block and change the size to 256 points and
then push "Close". Now, you see the magnitude and the phase of the signal
in the frequency domain. The magnitude has a sharp peak at 0.4189, the
frequency of our sinusoidal signal.
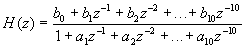
Close the output dialog box and click inside the filter box. We will
change some of the filter parameters. The shown numbers are parameters
of the transfer function of the filter. Make the following changes: b0
= 2 and a1= -0.5 and check the output of the system.
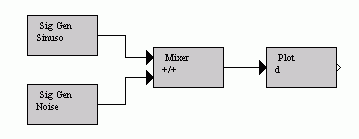
Now, delete the filter. The box along with its two connections are gone.
Instead of a filter, create now a second input box and an add box. Your
editor window should then look like the following:
Change the name of the second input box to ``Noise'' and the name of
the output box to ``Sig+Nois'' as shown in the Figure. The names are restricted
to ten characters. Following, we edit the new input box. Open the dialog
window and change the signal type to random. Choose a variance of 4 and
extend the pulsewidth to 256 samples, in order to have noise over the full
length of the signal. Now take a look at the output signal. In the time
domain it is very hard to see that a sinusoid is present. However, if you
view the signal in the frequency domain with an FFT of size of 256, then
you still find a peak at 0.4189. Please note that the squared magnitude
is shown.
This concludes the introduction to the J-DSP editor.
|
