|
J-DSP Assessment Results
This HTML page summarizes a series of assessment
results provided by the EEE407 students and various anonymous users.
First, an overview of the methods and the assessment tools developed for
the evaluation is presented. General and concept-specific
forms have been developed. The general forms are used to obtain an
overall subjective opinion on the J-DSP software. The concept-specific
forms provide the laboratory evaluation and its impact on learning
specific DSP concepts. Our newest assessment instrument, the
pre/post-lab assessment, focuses on evaluating whether learning of
certain topics is attributed specifically to using J-DSP.
The general assessment questionnaire consists
of a specific set of items that assess the ergonomics and the usefulness
of the J-DSP software. In this assessment, students provide information on
logistics, software capabilities, academic standing, browser
compatibilities, expediency of the user-manual, etc. Student responses
revealed that the GUI and the free access to J-DSP were received
positively. Most students found J-DSP simulations highly intuitive. In
fact, 95% of the students liked the concept of Internet-based simulations,
and 70% of the students responded that it took them less than 30 minutes
to learn how to use J-DSP. Moreover, 85.5% of the students agreed that
they would consider using J-DSP to construct their own educational
simulations.
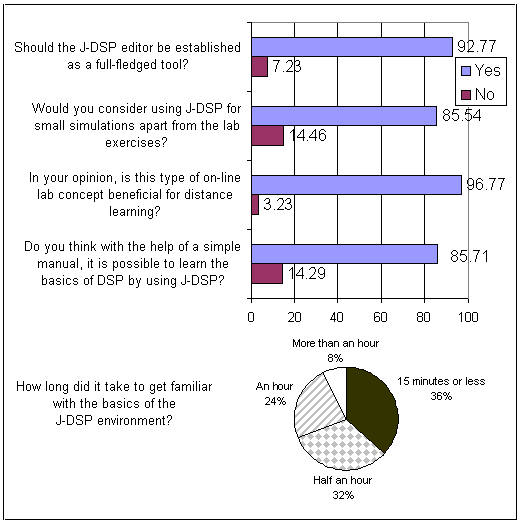
Figure 1
User feedback regarding J-DSP editor used in DSP Lab
The concept-specific assessment questions are
directly related to the technical aspects of the J-DSP on-line
laboratories. The concept-specific forms focus on each exercise by
posing questions that determine whether the student has learned a specific
DSP concept. For instance, 87% of the students agreed that the filter
design exercise helped them understand which window is suitable for sharp
transitions, 88% of the students understood better the signal symmetries
in the FFT spectra because of J-DSP visualization, and 91% of the students
reported that the Z-transform exercise helped them understand the relation
between the pole-zero locations and the frequency response plots. More
results are given in Table 1.
Table 1: Statistics based on the
concept-specific assessment
|
Evaluation Questions |
Strongly
Agree (%) |
Agree (%) |
Neutral (%) |
Disagree (%) |
Strongly Disagree (%) |
|
1.
J-DSP on-line labs help you better understand the concepts of the Z
transform |
50 |
46 |
3 |
1 |
0 |
|
2.
Your understanding of the concepts of FIR and IIR filter design is
enhanced by the J-DSP labs |
42 |
47 |
8 |
3 |
0 |
|
3.
The general concepts of using FFT in signal analysis is clear by
performing a J-DSP simulation |
24 |
61 |
13 |
2 |
0 |
|
4.
You have learned how to generate a sinusoid with a digital filter |
29 |
55 |
11 |
3 |
2 |
|
5.
The relationship between the impulse response and the transfer
function is clear |
95 |
N/A |
5 |
|
6.
After performing the J-DSP lab it is clear that the FFT spectral
resolution is limited by the FFT size, the window type, and the
window size |
99 |
N/A |
1 |
|
7.
Enough information is available on the help screens and the dialog
windows. |
49 |
33.5 |
13.5 |
|
8.
J-DSP labs accelerate the learning curve attributed to the basic DSP
concepts (Labs 1-4 average statistics) |
92 |
N/A |
8 |
In the evaluation Question-8 shown in Table 1, we
directly asked the students if the J-DSP and the on-line laboratories
accelerated the learning process. 92% of the students responded
positively. However, in order to obtain even more reliable statistical
results for this scenario, we developed the pre/post-lab assessment
questionnaire during the spring’03 semester. In the pre/post-lab
evaluation, the questions are technical and are set to evaluate the
student’s understanding of the key DSP concepts before and after
performing a particular J-DSP lab assignment. The pre/post quiz and
the lab are assigned after the relevant theory has been introduced in
class. This ensures that all the students have had some, or ideally the
same exposure to the topics covered in the lab, so that we can isolate
specifically the effect of the J-DSP labs in their learning. The students
are asked to complete the pre-lab assessment before working on a J-DSP
lab. After performing the J-DSP lab assignments, they submit the post-lab
assessment. The questions on the post-lab assessments are the same as the
pre-lab assessments but given in a different order.
Figure 2 shows the
pre/post-lab assessment results. Lab 1 is related to the Z-transform
and the frequency response and consists of six questions. A 20% average
improvement can be noted after performing the J-DSP lab-1. The percentage
improvement corresponding to lab-2 was significant, i.e., 45%. This can be
related to the fact that the lab-2 simulations involve seamless animations
of pole-zero locations and frequency response computations. This
assessment result was influential in re-designing most of the J-DSP blocks
to incorporate animations. Labs 3, 4, and 5 involve the FIR/IIR filter
design methods, the FFT computation, and the QMF filter bank analysis,
respectively. Improvements of 22%, 10%, and 15% can be noted in the labs
3, 4, and 5, respectively. A detailed analysis of the pre/post-lab
assessment results is given in [1].
Figure 2. Pre/post-lab assessment of
J-DSP labs [1]
|
