Digital filters are
programmable filters whose purpose is to allow the desirable portion of the
input signal to pass and cut off the part of the signal that is unwanted
DEMO Overview:
This DEMO is intended
to familiarize the students or participants with some basic concepts in
digital filters. It is divided into two parts: part A covers some basic
concepts in digital filters and part B goes through a speech filtering
example.
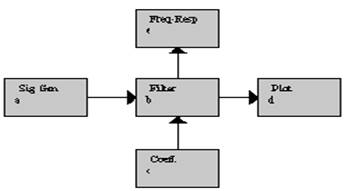
The student or
participant will make use of the J-DSP that simulates a source-filter
configuration. In J-DSP, a simple simulation of digital filtering consists
of 5 blocks, as shown below.
1.The source (Sig Gen)
block: A signal generator that generates the input signal to be filtered.
The user can choose from a variety of input signals (step function,
sinusoid, triangular, exponential, etc...).
2.The filter (Filter) and the filter coefficient (Coeff) blocks: By changing the filter
coefficients we can change the frequency response of the filter. Figures 1
and 2 show the ideal frequency response of the low-pass and high-pass
filters, respectively.
3.The frequency response (Freq Resp)
block plots the response of the filter depending on the filter
coefficients. It plots the normalized frequency versus the amplitude of the
filter response. The sampling frequency is set at 8 kHz the frequency that
most telephony signals are sampled at.
In J-DSP, all frequencies are
referenced to the normalized frequency. A simple formula that shows the relationship between the
normalized frequency and the actual frequency is:
Ω = 2πf / fs
where Ω is the normalized frequency, f the actual
frequency, and fsisthe
sampling frequency.
For example in J-DSP when Ω
= pithen the actual frequency is equal to fs/2. (f= fs/2).
4.The plot (Plot) block basically shows the output signal.
In other words it plots the filtered input signal.
Note that in order for J-DSP to
execute any parameter changes made on the blocks the user must press the
UPDATE button located on the bottom of each block window.
PART A: Basics on digital filters
Press Start
on the J-DSP Editor and follow the instructions below
STEP 1: The signal generator is feeding
the filter with a low frequency sinusoid with amplitude equal to one. Observe the filter
coefficients and the frequency response of the filter.
What is the normalized
frequency of the input signal? Ω = ____
Remember the general
transfer function of a digital filter:
In our case the general
transfer function simplifies to:
Take a note of the
coefficients: a0 = _____, a1 = _____, b0 = _____, and b1 = _____ .
Write the transfer
function:
Observe the frequency
response plot and state the kind of digital filter that is realized?
(All-pass? Low-pass? High-pass?) _____________
Observe the output. Has the
input sinusoid being altered by this filter?
(Check the output plot window and take a note of the amplitude of the
signal. You may choose to view the continuous or discrete output
signal by using the menu options of the Plotblock)
STEP 2: Change the following filter
coefficient. Set b1 = 1.0, and observe the frequency response of the filter.
Take a note of the new
coefficients: a0 = _____, a1 = _____, b0 = _____, and b1 = _____ .
Write the new transfer
function:
What kind of digital filter
is implemented? (Low-pass? High-pass?) _____________
Observe the output. Did the
amplitude of the output signal increase or decrease with respect to
the input signal? Write the amplitude of the output signal, | y[n] | = ____.
STEP 3: Change the following filter
coefficient. Insert a minus sign in front of the b1 coefficient. (therefore b1 = -1.0)
Observe the frequency
response plot of the filter.
·Write the new transfer function:
What kind of digital filter
is realized now? (Low-pass? High-pass?) _____________
Observe the output. Did the
amplitude of the output signal increase or decrease with respect to
the input signal? Write the amplitude of the output signal, | y[n] | = ____.
What can you conclude about
the effect of a high-pass filter on a low frequency input signal?
STEP 4: Make the following changes to
the filter coefficients. Set b0 = 1.0, b1 = 0.0 and a1 = -0.9
Observe the frequency
response plot of the filter.
Write the new transfer
function:
What kind of digital filter
is implemented now? (Low-pass? High-pass?) _____________
Observe the output. Did the
amplitude of the output signal increase or decrease with respect to
the input signal? Write the amplitude of the output signal, | y[n] | = ____.
STEP 5: Change the following filter coefficient.
Set a1 = 0.9.
Observe the frequency
response plot of the filter.
Write the new transfer
function:
What kind of digital filter
is implemented now? (Low-pass? High-pass?) _____________
Observe the output. Did the
amplitude of the output signal increase or decrease with respect to
the input signal? Write the amplitude of the output signal, | y[n] | =
____.
STEP 6: In order to understand the
difference of the effectof filtering between thelowandhigh frequency sinusoids set the signal
generator for a high frequency sinusoid with a normalized frequency equal to 0.8 x
pi. (Ω = 0.8 x pi). Also, set all the
filter coefficients to zero except a0 and b0. (a0 = 1.0 and b0 = 1.0).
Repeat Steps 1 through 5.
Note the difference between
the results when the input signal was a low frequency sinusoid with
those when the input signal was a high frequency sinusoid.
Compare the output of the
low-pass and high-pass filters for low frequency sinusoids.
Compare the output of the
low-pass and high-pass filters for high frequency sinusoids.
STEP 7:
Set the signal generator for a rectangular input, a step function u[n],
with pulsewidth = 64.
Observe the output on the Plot.
Is there a transient
response (region)? ______
How long, measured in terms
of samples, is the transient response? No. samples = ______
(Hint: Use the cursor on the plot window and choose between continuous
and discrete representation of the output signal).
THIS IS THE END OF PART A. PLEASE CLOSE THE J-DSP
EDITOR WINDOW.
PART B: Speech Example
***For this part of the DEMO you
will need a pair of speakers properly installed on your computer***
Press Start
on the J-DSP Editor and follow the instructions below
STEP 1: Press the Rerun
button of the long signal generator block (Sig. Gen (L))
then, press the
green button Play of the sound player (SndPlyr) block.
You have heard the original
audio sample without being subjected to any filtering.
Verify that the transfer
function defined by the given filter coefficients is an all-pass
filter.
Write the transfer
function:
STEP 2:
Change the following filter coefficients: Set a1 = -0.9. Repeat the
instructions given in STEP 1.
What range of the audio
spectrum has survived filtering? (Low frequencies? High frequencies?)
What kind of digital filter
is implemented? (Low-pass? High-pass?) _____________
Write the transfer
function:
STEP 3: Change the following filter
coefficients. Set a1 = 0.9. Repeat the instructions given in STEP 1.
What range of the audio
spectrum has survived filtering? (Low frequencies? High frequencies?)
What kind of digital filter
is implemented? (Low-pass? High-pass?) _____________
Questions:
What have you learned from
this DEMO?
Did you understand the
effect of digital filtering on sinusoids?YESNO
·Did you understand the difference between low and high pass
filtering?YESNO
·Did you understand the significance of digital filters on the speech
example?YESNO