J-DSP Lab 6:
Multi rate Signal Processing and QMF Banks
Introduction
The goal of this exercise is to
examine the effects and use of sampling rate conversion and simulate a two-band
QMF bank.
Problem 6-1:
Up-Sampling/Down-Sampling
Use a Sig
Gen block for input. Set the input to a “pulse width” 20 and “gain” 1.
Connect it to a junction block. One output of the Junction
block should be connected to a D-sampling block that should be
set to “rate” 2. The second output of the Junction block, along
with the output of the D-sampling block should now be connected
to two FFT blocks. Finally connect the FFT block
outputs to the inputs of a Plot2 block. Plot2
should now display the frequency responses of the original and the sampled
signals.
Questions:
1. Try to change the sampling
rate and note the change in the frequency response
2. Replace the D-sampling
block with an U-sampling block of rate
2. Observe the frequency response and repeat 1.
3. For question 2, add an
interpolation filter at the output of the up-sampler. Design a low pass
Butterworth filter with cut-off frequency p/M, where M is the up-sampling rate. Examine both the
time and frequency domain signals before and after the filter.
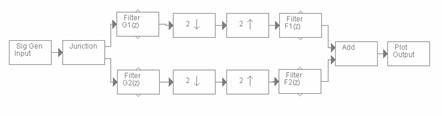
Problem 6-2: Two-Band
Filter Bank (QMF)
Go to the File menu at the top
of the editor and select ‘new’ to clear the workspace. Use again a signal
generator as the input. Connect it through a Junction block to
two Filter blocks. Connect the Filter blocks to two
D-sampling blocks and then to two U-sampling
blocks. Set the sampling rates to 2. The outputs of the U-sampling
blocks should now be connected to two more Filter blocks. The
output of the two filters should be added together using a Mixer
block. As a last step connect the Mixer block output to a Plot
block. The system should look like this:
To set the filter coefficients,
add Coeff. blocks
to Filter blocks and just type the coefficient values given below.
When finished, press the [update] button. After all filters have been set, look
at the output signal.
Nominal Filter coefficients:
|
G1(z) |
0.5 |
0.5 |
|
G2(z) |
0.5 |
-0.5 |
|
F1(z) |
1.0 |
1.0 |
|
F2(z) |
-1.0 |
1.0 |
Connect a Freq Resp block to the top output of each filter.
o
Plot and observe
the frequency response of each filter.
o
Compare the
input and output of the filter bank. Are the signals identical?
o
What is the
overall delay of the filter bank?
o
Change G1(z) to
0.7+0.5z-1
o
Compare the
input and output.
o
Design another
QMF filter with third order FIR filters and repeat the above steps.
Note: After you have entered the
coefficient values in the Coeff.
blocks, some may appear to be zero but they are just
truncated due to limited space. After you enter the coefficients, press
[update] just ONCE, the second time will pass the truncated values to the
filter.
Filter coefficients obtained
from: Sanjit K. Mitra and
James F. Kaiser, Handbook for Signal Processing. John Wiley & Sons, Inc.,