J-DSP Lab 4:
FIR and IIR Filter Design
Introduction
Lab 4 concentrates on FIR and
IIR filter design.
Problem 4-1: FIR Linear Phase
Systems
Consider the following four
impulse responses:
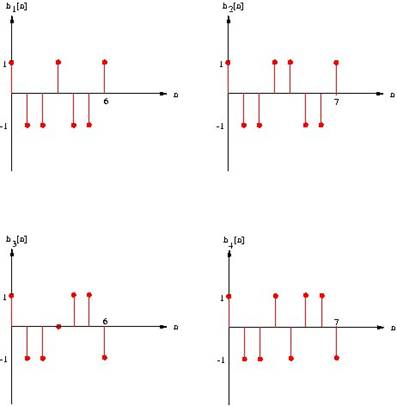
a) For each impulse response, find the transfer
function. Use J-DSP to plot the frequency response (magnitude and phase) of
each system.
(Hint: these are FIR filters - see if they have
symmetries)
b) For each system, describe the symmetries of the zeros
of H(z).
(Hint: use J-DSP to find the roots).
c) Determine the group delay of each system. Use the
tabulated values in the output dialog box to derive the exact group delay.
(Hint: plot the phase response and measure its slope)
d) Use J-DSP to obtain pole-zero plots and note
symmetries in the z plane.
Problem 4-2: FIR Design by
Windowing
Let
![]()
be the
ideal impulse response of a low-pass filter with a cutoff at 0.2p. To construct
a truncated version of this impulse response we will generate a sequence as
follows:
·
Signal type:
Sinc
·
Amplitude: 0.2
·
Pulse width: 120
samples
·
Periodic: No
·
Period T: 10
samples
·
Time Shift: 30
samples
These settings provide you with a
truncated, shifted, and causal version of the impulse response. Use a Window block and check
the frequency characteristics for each window in the following order:
a) Rectangular (default)
b)
c) Hamming
The
J-DSP flow-gram should look like this:
a) Check the magnitude and phase response for each
impulse response.
b) Observe that all designs are linear phase. (why?)
c) Observe that with rectangular window truncation you
get the narrowest transition but the worst ripple effect.
d) Note that tapered windows have better behaved side
lobes and hence better-behaved ripple effect relative to the rectangular
window.
Problem 4-3: FIR Design using the
Kaiser Window
Design a high-pass filter with
generalized linear phase using the Kaiser window
method.
Use the following
specifications:

![]()
Use the Kaiser block for the filter
coefficients and plot the frequency response of the filter. Use the following
J-DSP flow-gram. Double click on the Kaiser block and enter
appropriate parameters. Convert tolerances in dB.
Problem 4-4: IIR Filter Design
In this part, you will design an
IIR filter with J-DSP. The filter will be designed using four different IIR methods
(Butterworth, Chebychev I, Chebychev II and Elliptic) so that results of the 4
different methods can be compared. The specifications for the filter are shown
below.
·
Filter Type = Low-pass
·
Cutoff
frequencies: wp1 = 0.4p and ws1 = 0.6p
·
Tolerance in
pass-band = 1.0dB
·
Tolerance
(rejection) in stop-band = -45.0dB
The design can be done using the
IIR block under the filter blocks menu in J-DSP. This block will
automatically calculate the filter coefficients based on the filter
specifications provided, using a bilinear transformation for any of the four
design methods mentioned above. Attach the output of the IIR
block to a Freq-Resp block to get a plot of the filter's
frequency response or to a PZ-Plot block to see a plot of its
poles and zeros, or both through a junction block. Note that the IIR block will
calculate filters with a maximum of 10 filter coefficients. Enter the cutoff frequencies into the IIR
block as fractions of the sampling frequency.
For wp1=0.4p simply enter 0.4.
For each of the four filter
designs, do the following:
1. Plot the filter's frequency response.
2. Create a pole-zero plot of the filter.
3. Note the order of the filter.
4. Examine the filter's frequency response in the pass-band
and in the stop-band.
5. Observe the phase response of each design.
Design the filter using each of
the following four methods.
1. Design an IIR Butterworth filter according to the
given specifications.
2. Redesign the filter using the Chebyshev I method.
3. Repeat the process using a Chebyshev II filter. Plot
the frequency response on a dB scale.
4. Finally, design using an Elliptic filter. Observe its
frequency response in the pass-
band on
a linear scale and its response in the stop-band on a dB scale.
Try to provide answers to the
following questions:
·
Which filter
requires the highest order to meet the specifications?
·
Which filter
requires the lowest order to meet the specifications?
·
Do any of the
four filters have linear phase?
·
Where does the
greatest deviation from constant group delay occur?
·
Which of the
four filters is equi-ripple in the pass-band and monotonic in the stop-band?
·
Which of the
four filters is monotonic in the pass-band and equi-ripple in the stop-band?
·
Which of the
four filters is equi-ripple in both the stop-band and the pass-band?
·
Which of the
four filters is monotonic in both the stop-band and the pass-band?
·
For the filters,
which are monotonic in the pass-band, where are all the zeros located?
If you have time, try the above exercise using a high-pass filter and a band-pass filter of your choice.