J-DSP Lab 2:
The Z-Transform and Frequency Responses
Introduction
This lab exercise will cover the Z transform and the
frequency response of digital filters. The goal of this exercise is to
familiarize you with the utility of the Z transform in digital signal
processing. The Z transform has a similar role in DSP as the
a)
It provides intuition in certain cases, e.g., pole
location and filter stability,
b)
It facilitates compact signal representations, e.g.,
certain deterministic infinite-length sequences can be represented by compact
rational z-domain functions,
c)
It allows us to compute signal outputs in
source-system configurations in closed form, e.g., using partial functions to
compute transient and steady state responses.
d)
It associates intuitively with frequency domain
representations and the Fourier transform

This is essentially realized as an I/P-O/P difference
equation of the form
![]()
The transfer function is associated with the impulse
response and hence the output can also be written as
![]()
Here, * denotes convolution; x(n)
and y(n) are the input signal and output signal respectively. If the
input to the Filter block is an impulse, the output of the Filter
block will be h(n), i.e., the inverse Z transform of the
system function H(z). For all frequency responses use a Fast Fourier
Transform (FFT) of size 256 by choosing “FFT size” 256 in the FFT
block dialog window.
Problem 2-1: Exponential Sequences
We have seen that single pole
IIR filters have exponential impulse responses. Design and simulate a digital
filter that has the impulse response
![]()
(Hint:
you can synthesize this by exciting an appropriate filter with a unit impulse. u(n) is the unit step signal and it simply implies that n
>=0 ,i.e., h(n) is causal)
a) Give
the simulation diagram and a transfer function: H(z) =? Corresponding
to h(n) ?
b) Use
J-DSP to plot the impulse response.
c) Use J-DSP
to simulate and plot the frequency response:
Is
this LPF or HPF?
Is the
filter stable?
Write
the poles and zeros of the system.
What would be the
closest analog circuit to this first order filter (only for 2.1.3)?
d) Repeat from a) to c)
![]()
Note that u(n-1) simply denotes
that the signal starts at sample one.
![]()
Hint: Remember the z-transform
pair.
![]()
Realize this as a filter using
J-DSP
e) Given the transfer function
for a causal system
![]()
i) Does
this transfer function represent a stable system?
Problem 2-2: Digital Oscillator
Digital oscillators can be
designed by selecting the coefficients of the digital filter so that we get
oscillatory behavior when the excitation is a unit impulse.
Design and
simulate a digital oscillator for a sampling frequency of 8000 Hz and a
sinusoidal frequency of 687 Hz. Note that the impulse response must be of the
form:
![]()
Use
J-DSP to plot the frequency response and the poles and zeros.
Hint: find the frequency in radians
Problem 2-3: Canceling Sinusoidal
Components
Filters
can be designed to cancel sinusoids.
Consider a system with the following impulse response:
![]()
The
input signal to the system is

To
generate the input signal, use the following parameters:
o
Signal Type:
sinusoid
o
Amplitude: 1
o
Time Shift: 0
For
this problem, please address the following:
i) Plot the frequency response and observe poles
and zeros.
ii) Simulate the convolution y(n) = x(n)*h(n) by
programming h(n) as an FIR filter for the two sinusoidal inputs
above. Use J-DSP and plot the output of
the system.
iii)
Note the behavior of this system with the two sinusoidal inputs above. When do we get cancellation?
Problem 2-4: Symmetric Impulse
Response Produces Linear Phase
Linear phase filters have
constant group delay and are important in some applications, i.e., high-end
audio amplifiers and systems. Consider
the following system with a symmetric impulse response:
![]()
a) Simulate the system in J-DSP and look at the phase
response (use Freq Resp block).
b) Comment on the phase response (what is the
slope?). What is the group delay of the
filter?
c) Use pole-zero display and check for symmetries in the
locations of zeros.
(Note
that because of symmetry in h(n) we get symmetrical
zeros in the z plane)
The group delay is the negative
of the derivative of the phase with respect to the frequency. The group delay is measured in samples and
can be determined from the slope of the phase.
Problem 2-5: Pole-Zero Plots
Let us
now consider the role of poles and zeros in digital filters and their frequency
response.
The
figure below shows the pole-zero configuration of two
linear time-invariant systems:
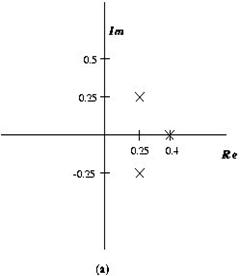
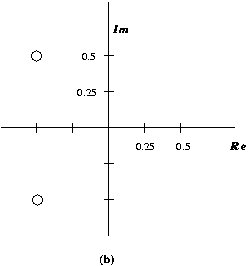
For
each system,
a) Determine the coefficients of H(z) (use some simple algebra to form the filter
coefficients)
b) Simulate and obtain the impulse response and
frequency response of the two filters.
c) What are the effects of the poles and zeros on the
frequency response?
Problem 2-6: Cascade and Parallel System Configurations
a) Consider the following system:
![]()
Hint: Cascade
configurations. Note that this is a
convolution of two exponential signals
i) Implement the system using one Sig Gen,
two Filter, two Coeff, blocks, and one Plot
block for c = 0.5 and d = 0.25. Sketch the output of the system.
ii) Implement the system using one Sig Gen,
one Filter, one Coeff.
block, and one Plot block for c = 0.5 and d = 0.25
b) Consider the following system parallel configurations:
![]()
i) Implement the system using two Sig Gen,
two Filter, two Coeff. blocks, one Mixer and one Plot
block.
ii) Implement the system using one Sig Gen,
one Filter, one Coeff. block, and one Plot block.